Understanding the Statistical Implications of Undetected Risk
Nonadherence in clinical trials plays a significant role in influencing the quality of data, trial results and, subsequently trial cost and duration. It may stem from unintentional drivers, such as forgetfulness, poor organizational skills, protocol regimen complexity, or experiencing an Adverse Event.
Nonadherence in clinical trials plays a critical role in influencing data quality, trial results and, subsequently trial cost and duration. In a previous article, we discussed the financial impact of investigational medical product (IMP) nonadherence in clinical trials. It is estimatedthat greater than 20% of patients never take the IMP [1]leading to high rates of trial failure. Nonadherence is endemic across all sponsors and all indications. In this article, we (a) define three types of clinical trial nonadherence that directly impact data quality and hypothesis testing, (b) quantify the impact of nonadherence on sample size estimation, and (c) discuss the implications of nonadherence on drug development.
Three Types of Protocol Nonadherence Directly Impact Hypothesis Testing


Three distincttypes of nonadherence directly impact hypothesis testing in a clinical trial: (a) IMP nonadherence; (b) early discontinuation from the study; and (c) fraud. Each type of behavior impacts data quality, sample size estimation, and the interpretation of trial results leading to potentially higher costs, longer trial durations, and sometimes study failure.
What is IMP Nonadherence and How is it Calculated?
In many protocols, IMP nonadherence is defined as multiple missed doses; the industry typically defines IMP nonadherence as an adherence rate of 80% or less. This type of nonadherencemay stem from unintentional drivers, such as forgetfulness, poor organizational skills, protocol regimen complexity, or experiencing an Adverse Event (AE). While pill counts are used for medication accountability and as a measure of IMP adherence, the bulk of nonadherence is left undetected. For example, if a subject forgets to take their morning IMP, and double doses in the evening, drug accountability practices will not be able to detect this type of nonadherence, increasing the risks for AEs. The statistical implications of IMP nonadherence on clinical trials include: (a) underpowered results during statistical analyses, and (b) misinterpretation of trial results based on inaccurate data (which includes safety and efficacy results).
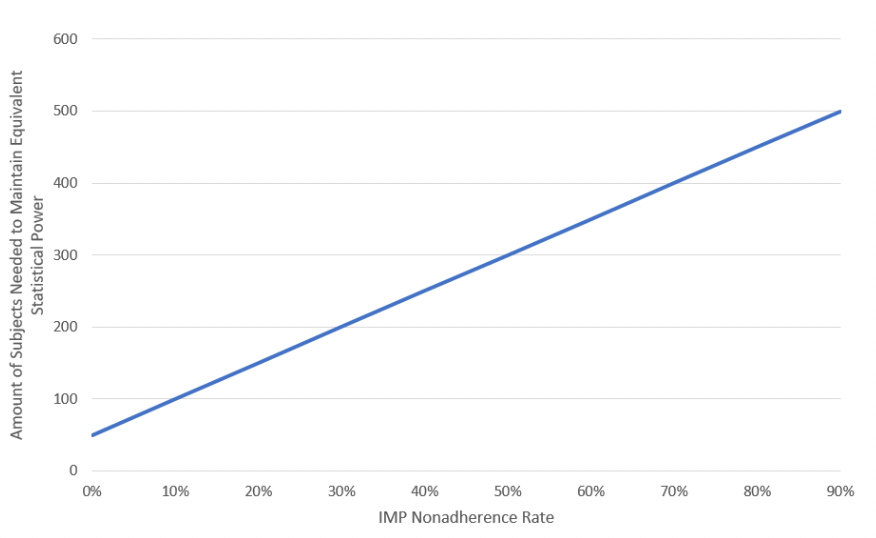
According to the literature, a 20% nonadherence rate amongst subjects requires a 50% increase in a trial’s sample size to maintain equivalent statistical power. A 50% increase in nonadherence requires a 200% increase in the trial sample size [2, 3]. For IMPs with a positive exposure-response relationship, an increase in adherence results in higher serum IMP concentration levels, which typically translates to a more significantresponse on the primary efficacy endpoint. Accordingly, we used the assumption above and simple mathematics to generate a slope. The equation Y = MX + B (also known as the linear equation) is the standard formula to describe any straight line. In this particular case, Y is the sample size, M is the slope of the line, B is the Y-intercept, and X is the IMP nonadherence rate.
Equation 1: Calculating IMP Nonadherence
- [Required Sample Size Multiplier] = 5 * [Nonadherence rate] – 0.5
- [Estimated Actual Sample Size] = [Original Estimated Sample Size] + ( [Original Estimated Sample Size] * [Required Sample Size Multiplier] )
Example:
INPUTS
CALCULATION
OUTPUT
Original Estimated Sample Size
Nonadherence Rate
Required Sample Size Multiplier
Estimated Actual Sample Size
100
0.2
(5 * 0.2) - 0.5 = 0.5
100 + (100 * 0.5) = 150
What is Study Dropout and How is it Calculated?
Subject Dropout is a commonform of nonadherence faced by almost all clinical trials. A dropout rate is usually factoredintoa trial’s sample size estimate during the design phase. According to the literature, dropout rates range from 20%-30% [4, 5].
Equation 2: Calculating Dropout
- [Actual Estimated Sample Size] = [Original Estimated Sample Size] / 1 – [Dropout Rate]
Example:
Inputs
Calculation
Output
Original Estimated Sample Size
Dropout Rate
Dropout calculation
Actual Estimated Sample Size
100
0.3
100 / (1 – 0.3)
143
Dropouts have the least impact on swelling the trial sample size unless dropout rates increase substantially (as the trial sample size moves asymptotically towards infinity).
What is Fraud and How is it Calculated?
Several forms of deceptive practices in clinical trials have been reported in the literature. These have focused mainly on professional subjects who simultaneously enroll in several trials or who enroll across several sites within a single study. These patients may also fabricate symptoms and learn study criteria requirements to qualify for enrollment [6, 7]. Another distinct behavior involves subjects attempting to deceive investigators and sponsors into thinking that they are taking the IMP according to the protocol, when in reality, they are discarding the IMP, e.g. intentionally attempting to circumvent the clinical trial process and rules of the protocol. According to AiCure who uses Artificial Intelligence (AI) to assist patients with taking IMP and captures data around adherence behaviors and response to treatment [8], the prevalence of persistent fraud in clinical trials may be as high as 28% [4, 11], depending on the indication.
Unlike IMP nonadherence or study dropout, fraud may have a more significant impact ondata quality and program costs simply because until recently, it has gone undetected. While pharmacokinetic (PK) sampling can tell you whether a subject has a detectable blood serum level or not, it cannot differentiate IMP nonadherence from fraud, e.g. a patient forgetting to take a pill on a Saturday night vs a patient deliberately committing fraud.
The equation for fraud is calculated similarly to IMP nonadherence. We estimate the numberof subjects who are fraudulent, calculate their nonadherence rate, determinethe increase in the sample size, and re-insert that sample size intothe study. By taking the fraud sample out and estimating the increase in the sample size, we are isolating this calculation from the rest of the sample, which yields higher precision in sample size estimation.
Equation 3: Calculating Fraud
- [Fraud Sample Size] = [% of Fraudulent Subjects] * [Original Estimated Sample Size]
- [Required Fraud Sample Size Multiplier] = 5 * [Fraud Nonadherence rate] – 0.5
- [Estimated Fraud Sample Size] = ( [Fraud Sample Size] * [Required Fraud Sample Size Multiplier] )
- [Estimated Actual Sample Size] = [Estimated Fraud Sample Size] + [Original Estimated Sample Size]
Example:
Inputs
Calculation
Output
Original Estimated Sample Size
% of Fraudulent Subjects
Fraud Nonadherence Rate
Fraud Sample Size
Required Fraud Sample Size Multiplier
Estimated Fraud Sample Size
Estimated Actual Sample Size
100
0.1
0.8
100 * 0.1 = 10
(5 * 0.8) – 0.5 = 3.5
(10 * 3.5) = 35
35 + 100 = 135
Comparing the Impact of The Three Types of Nonadherence on Trial Sample Size
In this section, we examinethe impact that each of these nonadherence types has on trial sample size. To simplify the analysis, we fix the original sample size at 100 subjects and input the remaining variables in the equations above.
IMP Nonadherence
Using Equation 1, Figure 1demonstrates the impact of increasing IMP nonadherence on trial sample size. As the IMP nonadherence rate increases (X-Axis), data dispersion also increases, which lowers statistical power, subsequently requiring an increase inthe trial’s sample size to maintain equivalent statistical power.
Figure 1: Impact of IMP Nonadherence on Trial Sample Size


Subject Dropout
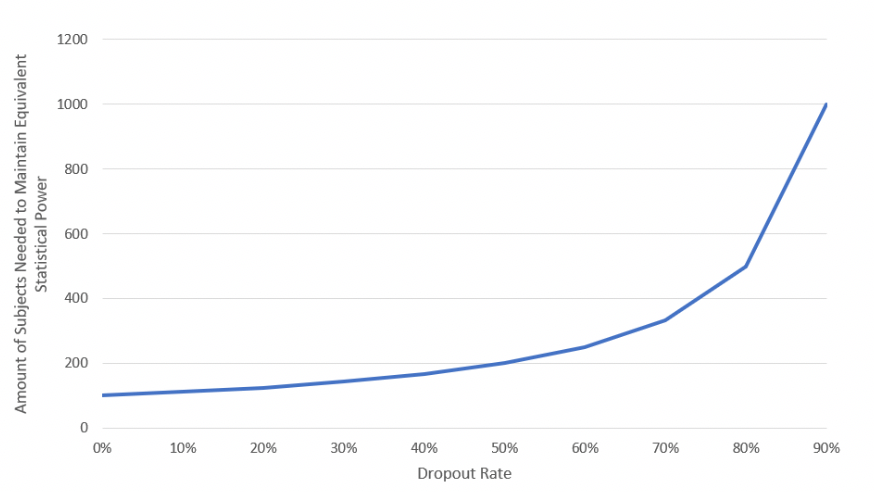
Subject dropout is a relatively simple calculation (Equation 2); Figure 2shows that as the dropout rate increases, the required number of subjects also increases asymptoticallyuntil it reaches infinity when the dropout rate reaches 100%.
Figure 2: Impact of Dropout on Trial Sample Size


Subject Deception
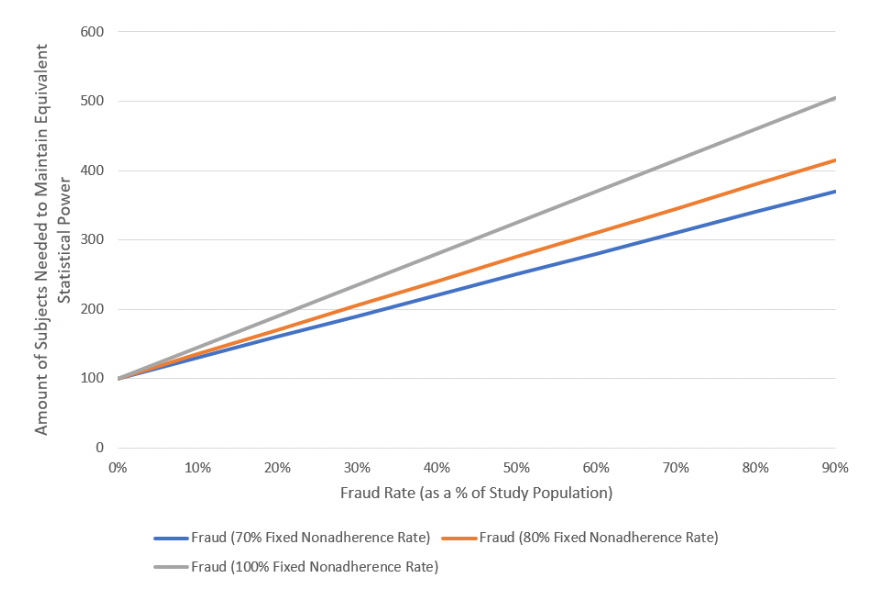
Figure 3illustrates the graphical output of deception when utilizing Equation 3. The X-Axis demonstrates the prevalence of fraud (i.e., what percentage of subjects in the trial’s sample size are fraudulent). We also evaluated three scenarios with nonadherence at 70%, 80%, and 100%. Figure 3shows that an increase in fraud prevalence increases the required sample size, whereas an increase in nonadherence raises the slope of the required sample size (having a higher impact as fraud prevalence increases).
Figure 3: Impact of Fraud on Trial Sample Size


Impact of Nonadherence on Drug Development
Since these equations are basedon theoretical modeling, it is unrealistic to assume you would run a study requiring an unusuallyhigh number of subjects (i.e., 600 patients when you initially estimated 100). It is important to note that if the equations estimate veryhigh sample sizes, the theory suggests that your trial is underpowered, given the inputted assumptions.
In practice, instead of enrolling a high volume of subjects to make up for undetected nonadherence, sponsors are implementing precision-based strategies to enrich data quality associated with nonadherence dilution [9]. These strategies include ‘switching’ nonadherent subjects to the placebo arm, placebo lead-in periods to exclude nonadherent subjects, and pre-specifying rates of nonadherence and fraud into the protocol to form the bases of significant protocol deviations. Additionally, there is a trend towards recognizing some of the challenges around intent-to-treat (ITT) analyses and understanding that this type of analysis may not always target “the treatment effect of greatest relevance to regulatory and clinical decision making,” according to changes in FDA thinking on the topic [10].
Amalgamating all Three Types of Nonadherence
Estimating a trial’s sample size requires precise data around IMP adherence, dropout rates and fraud. Once you obtain those assumptions, you can plug them into the equations to generate an amalgamated estimation for the trial’s sample size (in other words, the statistical power of your sample). It is also important to note that trial underpowering is not a direct result of one of the three nonadherence factors, rather it is the amalgamation of all three. Hence, you will often find that one nonadherence factor will overcompensate for another when powering study results.
Summary
The use of imprecise methods to capture nonadherence data as well as strict definitions of what constitute nonadherence present risk to drug development. Inaccurate and incomplete data sets impact the entire clinical trial process leading many trials to fail and resulting in Type 2 errors (false negatives). Indeed, studying a drug’s efficacy and safety profile without regard to true dosing patterns is a scientific lapse [6, 12]. From central nervous system (CNS) trials to cardiovascular to oncology, moving towards methodologies that incorporate all three types of nonadherence behaviors may help improve data quality, hypothesis testing, and significantly reduce the risk of trial failure. In the next article, we will discuss scenarios for quantifying the impact of nonadherence on clinical trial cost and duration.
Disclaimer: Moe Alsumidaie has served as an advisor or consultant to AiCure and MetroPlus Health Plan and PerkinElmer.
References:
[1] Maurizio Fava, director of the Division of Clinical Research. World Medical Innovation Forum, 2018. https://worldmedicalinnovation.org/wp-content/uploads/2018/09/Partners-ZMAG-Forum-2018-Recap-180503_1202-ZMAG.pdf
[2] Smith, D. L. (2012). Patient Nonadherence in Clinical Trials: Could There Be a Link to Postmarketing Patient Safety? Drug Information Journal, 46(1), 27–34. https://doi.org/10.1177/0092861511428300
[3] Alsumidaie, M. Non-Adherence: A Direct Influence on Clinical Trial Duration and Cost. Applied Clinical Trials. April 24, 2017. http://www.appliedclinicaltrialsonline.com/non-adherence-direct-influence-clinical-trial-duration-and-cost
[4] Tointon, A. The issue of patient retention in clinical trials. CenterWatch News Online. June 27, 2016. https://www.centerwatch.com/news-online/2016/06/27/issue-patient-retention-clinical-trials/
[5] Yadlapalli, J. S. K. B., & Martin, I. G. (2012). Seeking Predictable Subject Characteristics That Influence Clinical Trial Discontinuation. Drug Information Journal, 46(3), 313–319. https://doi.org/10.1177/0092861512440850
[6] Lee CP, Holmes T, Neri E, Kushida CA. Deception in clinical trials and its impact on recruitment and adherence of study participants. Contemp Clin Trials. 2018 Sep;72:146-157. doi: 10.1016/j.cct.2018.08.002
[7] Devine EG, Waters ME, Putnam M, Surprise C, O'Malley K, Richambault C, Fishman RL, Knapp CM, Patterson EH, Sarid-Segal O, Streeter C, Colanari L, Ciraulo DA. Concealment and fabrication by experienced research subjects. Clin Trials. 2013;10(6):935-48. doi: 10.1177/1740774513492917.
[8] Source: AiCure. www.aicure.com
[9]Enrichment Strategies for clinical Trials to Support Determination of Effectiveness of Human Drugs and Biological Product: Guidance for Industry. March 2019. Center for Drug Evaluation and Research (CDER). FDA. https://www.fda.gov/downloads/Drugs/GuidanceComplianceRegulatoryInformation/Guidances/UCM332181.pdf
[10] E9(R1) Statistical Principles for Clinical Trials: Addendum: Estimands and Sensitivity Analysis in Clinical Trials. June 16, 2017. Center for Drug Evaluation and Research (CDER). FDA. https://www.fda.gov/downloads/Drugs/GuidanceComplianceRegulatoryInformation/Guidances/UCM582738.pdf
[11] Shafner, L., Bardsley, R., Hall, G., & Hanina, A. (2018). Using Computer Vision and Machine Learning to Identify Patterns of Fraudulent Participant Activity in CNS Trials. American Society of Clinical Psychopharmacology Annual Scientific Meeting Proceedings. https://pmg.joynadmin.org/documents/1005/5afde1ec68ed3f2e245822b9.pdf
[12] Urquhart J. Patient compliance as an explanatory variable in four selected cardiovascular studies. In: Cramer J, Spilker B, editors. Patient compliance in medical practice and clinical trials. New York: Raven Press; 1991.


